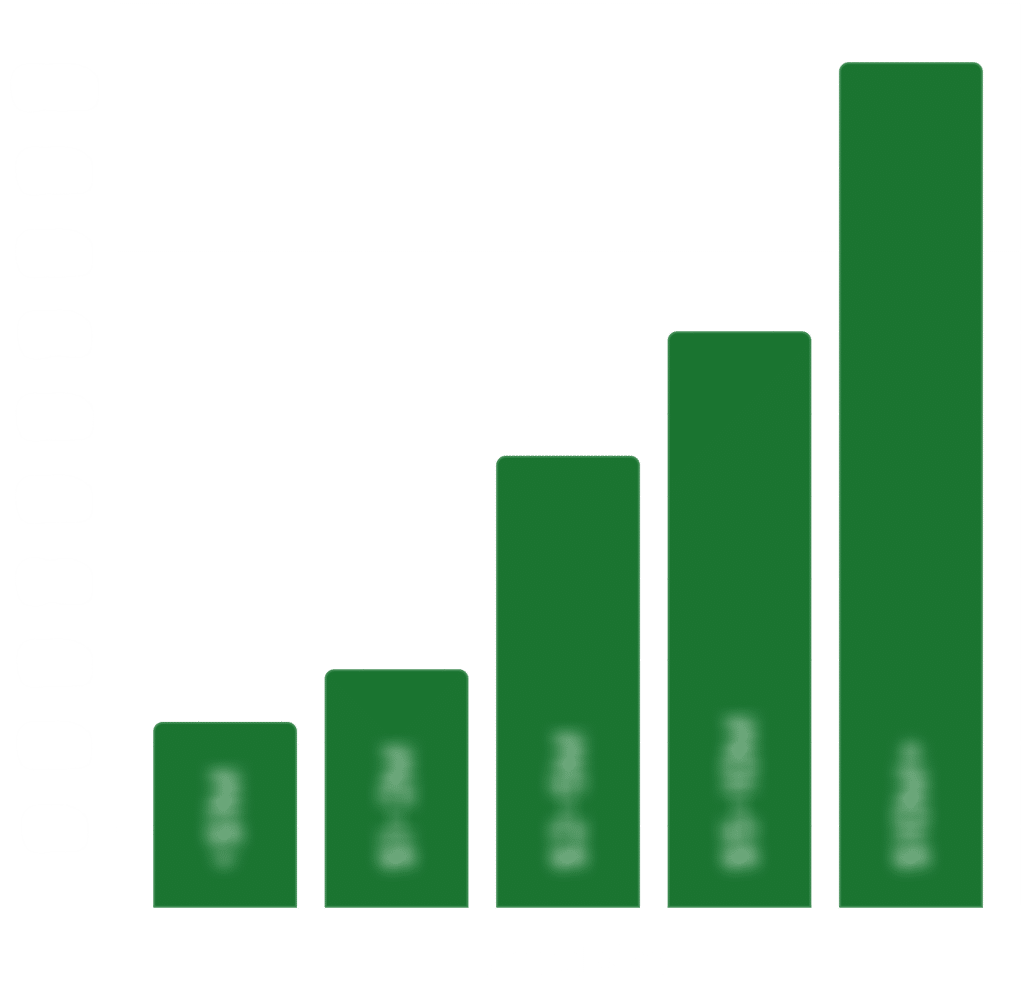
First-party data collected from verified brands and validated using statistical data cleaning.
Filter by brand annual revenue![]()
Sign up to access filters and full data
Filter by product category![]()
Sign up to access filters and full data
Filter by features used![]()
Sign up to access filters and full data
Show filters Scroll →
Filter by brand annual revenue![]()
Sign up to access filters and full data
Filter by brand product category![]()
Sign up to access filters and full data
Filter by vendor features used
Sign up to access filters and full data
Pricing data can vary depending on brand usage, features deployed and service level. Use filters to control for these and other variables.
First-party data collected from verified brands and validated using statistical data cleaning.
Filter by brand annual revenue![]()
Sign up to access filters and full data
Filter by product category![]()
Sign up to access filters and full data
Show filters
Filter by brand annual revenue![]()
Sign up to access filters and full data
Filter by brand product category![]()
Sign up to access filters and full data
Filter by vendor features used
Sign up to access filters and full data